
Covid-19 and Prisons
Prisons and their effects on the surrounding community
It is becoming clear that prisons, meat-packing plants, and nursing homes all resemble cruise ships in terms of providing a fertile environment for rapid spread of the virus. Unlike cruise ships, none of these are isolated from their surrounding communities - staff enter and leave on a daily basis, potentially spreading the virus nearby.
There are a few counties that have “specialized” in hosting prisons, to the extent that a large fraction of the county population is inmates. There are about 25 counties for which the inmate population makes up greater than 5% of the county population - and up to almost 25% in one case.
Growth Rates
We look at the last 5 days, and average the daily percent change in the number of cases. If there are no new cases, this number is zero. If the number of cases is doubling every day, then this number is 100%.
First let’s compare the overall distribution of recent growth rates and highlight counties with a prison population greater than 5% of the county population.
One important caveat. For reasons that I do not understand, the state COVID-19 case counts do not include prison inmates. So the county case numbers are for non-incarcerated residents of those counties only.
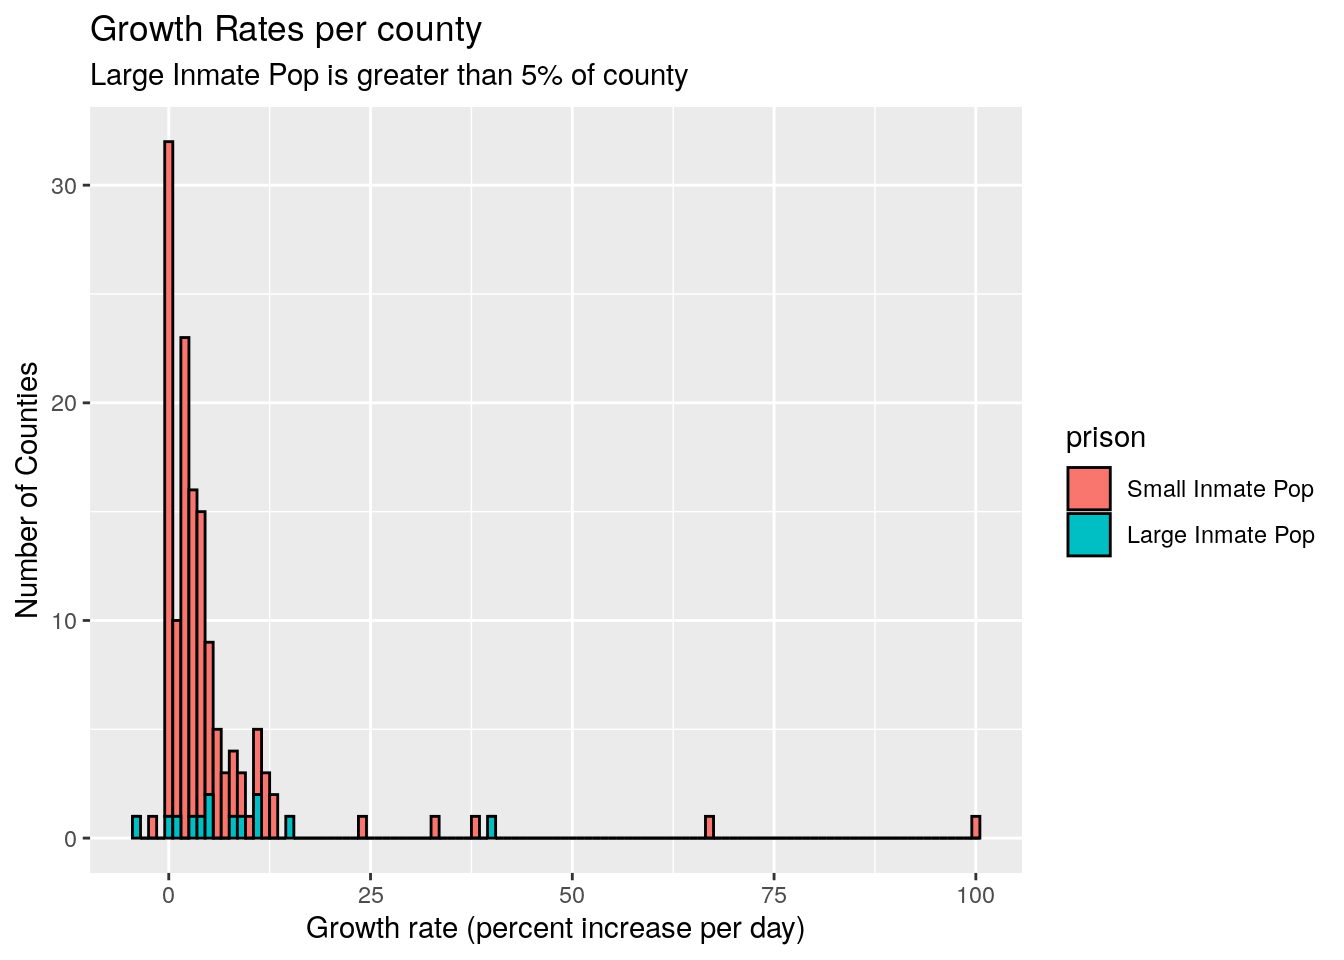
It appears that there is a a bias towards counties with large inmate populations (relative to the county population) having a higher growth rate in COVID cases.
Dose response plotting
Let’s separate out those counties with a large inmate population, and plot the size of the inmate population against the growth rate. If there is a relationship, then higher inmate population counties should show a higher growth rate.
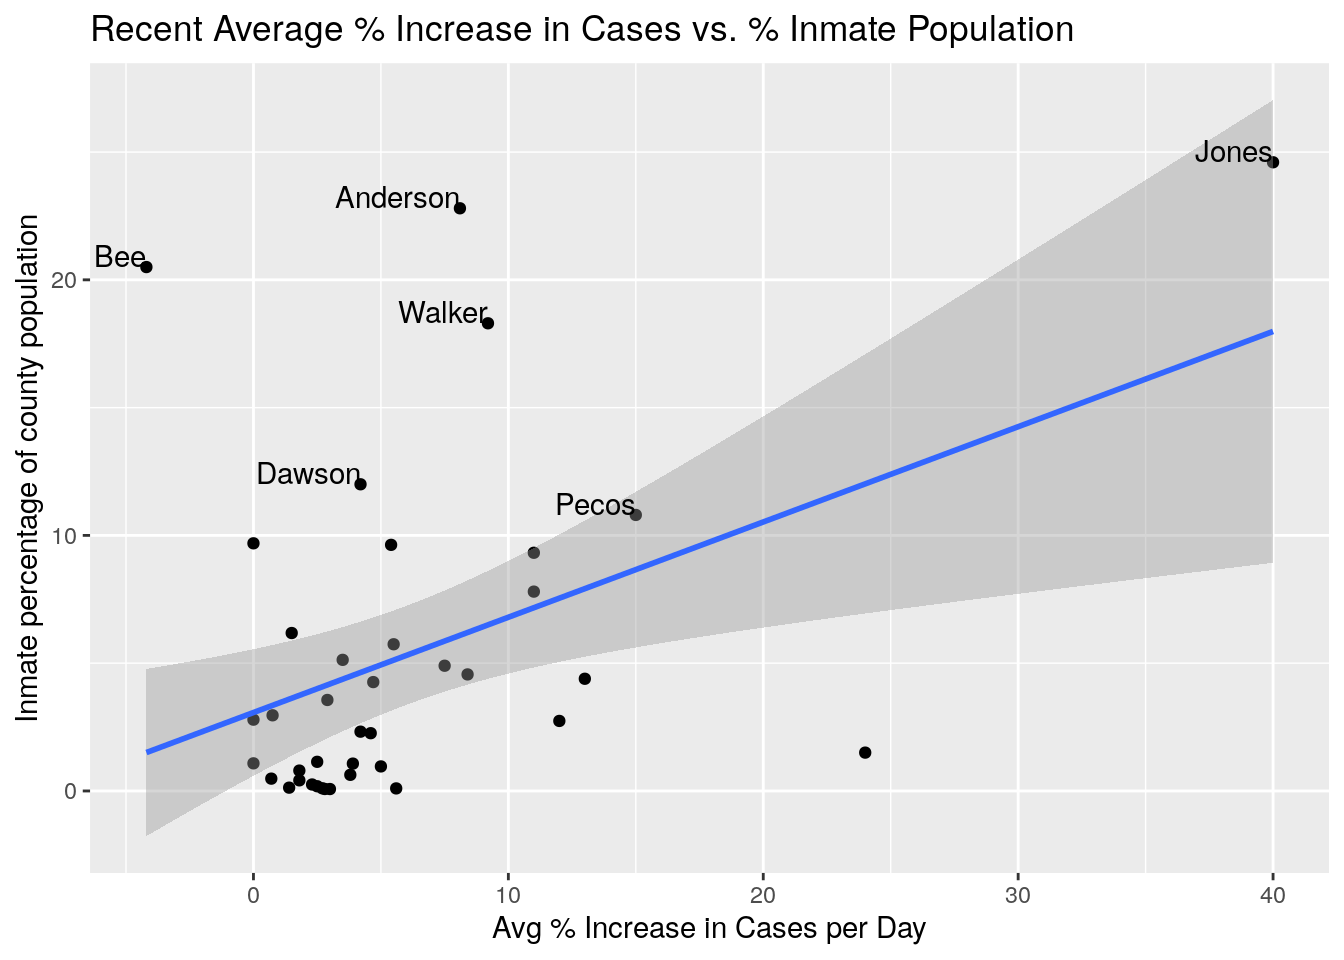
This looks compelling, but what if it is being dominated by Jones county, which is quite the outlier. Let’s plot it again, eliminating Jones from consideration.
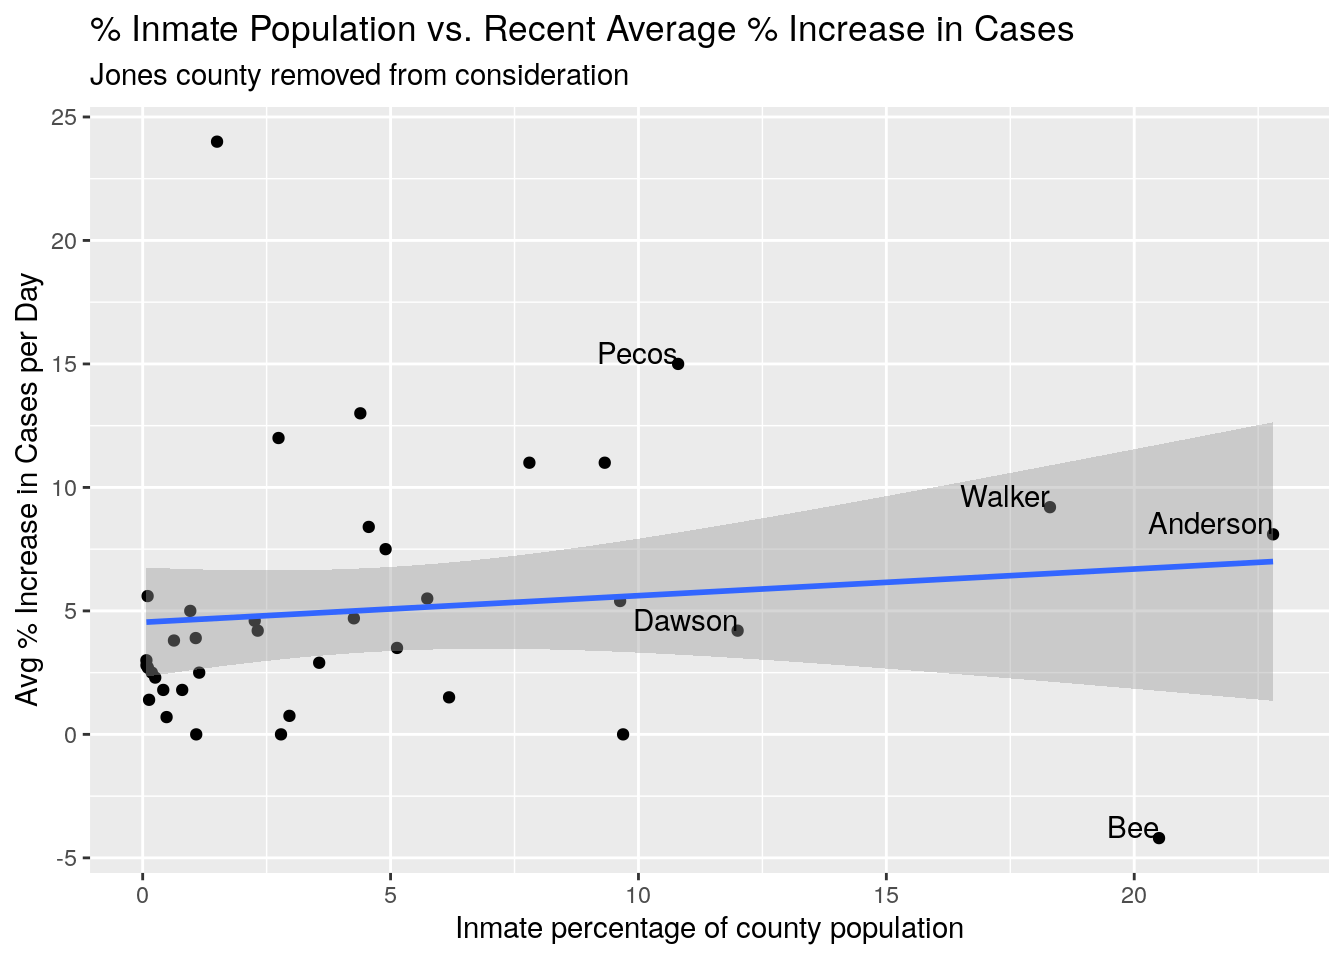
So what we see is that there is still a strong correlation, with a slope of 0.11 increase in cases / inmate percentage, and a less than stellar R squared of -0.0126.
Note that Bee county has only reported 6 cases, so any statistics done there are suspect. So far tests at the prisons in the county have turned up one positive, so they may be in good shape, hopefully.
Test Data
The state does supply data on tests and results for each prison unit, both for inmates and staff, so let’s take a look at that as well.
Since we are looking at counties, not individuial prison units, prisons within a single county will be combined.
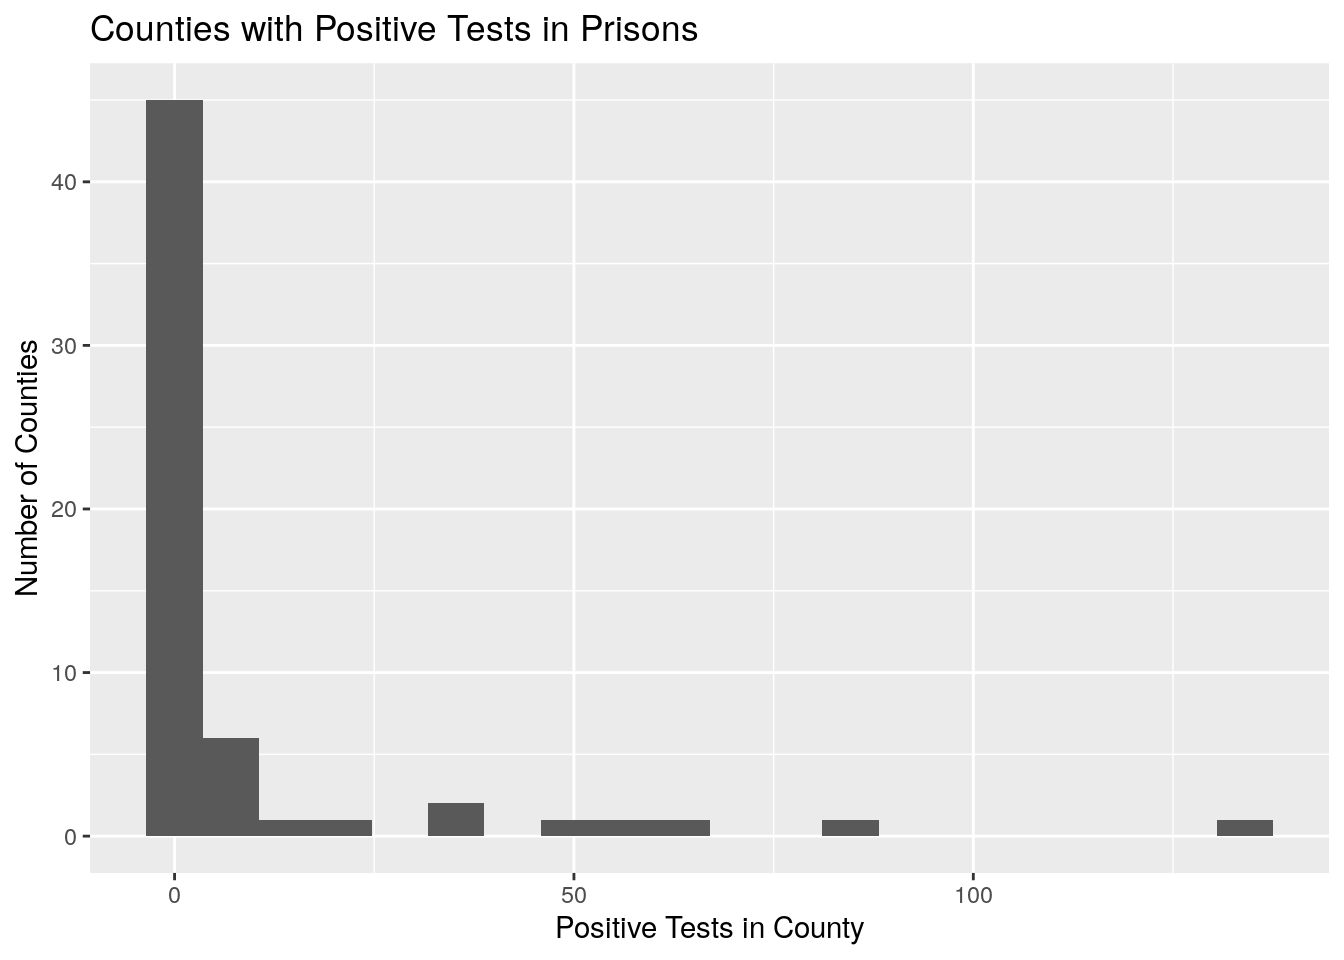
So the good news is that most counties with prisons, apparently have no COVID-19 cases in those prisons, yet. However, it should be noted that since over 2/3 of the tests yield a positive result, far too few inmates are being tested. The actual positive numbers are all but guaranteed to be significantly higher than shown.
Which are the high case count counties? And how do they compare to their host counties?
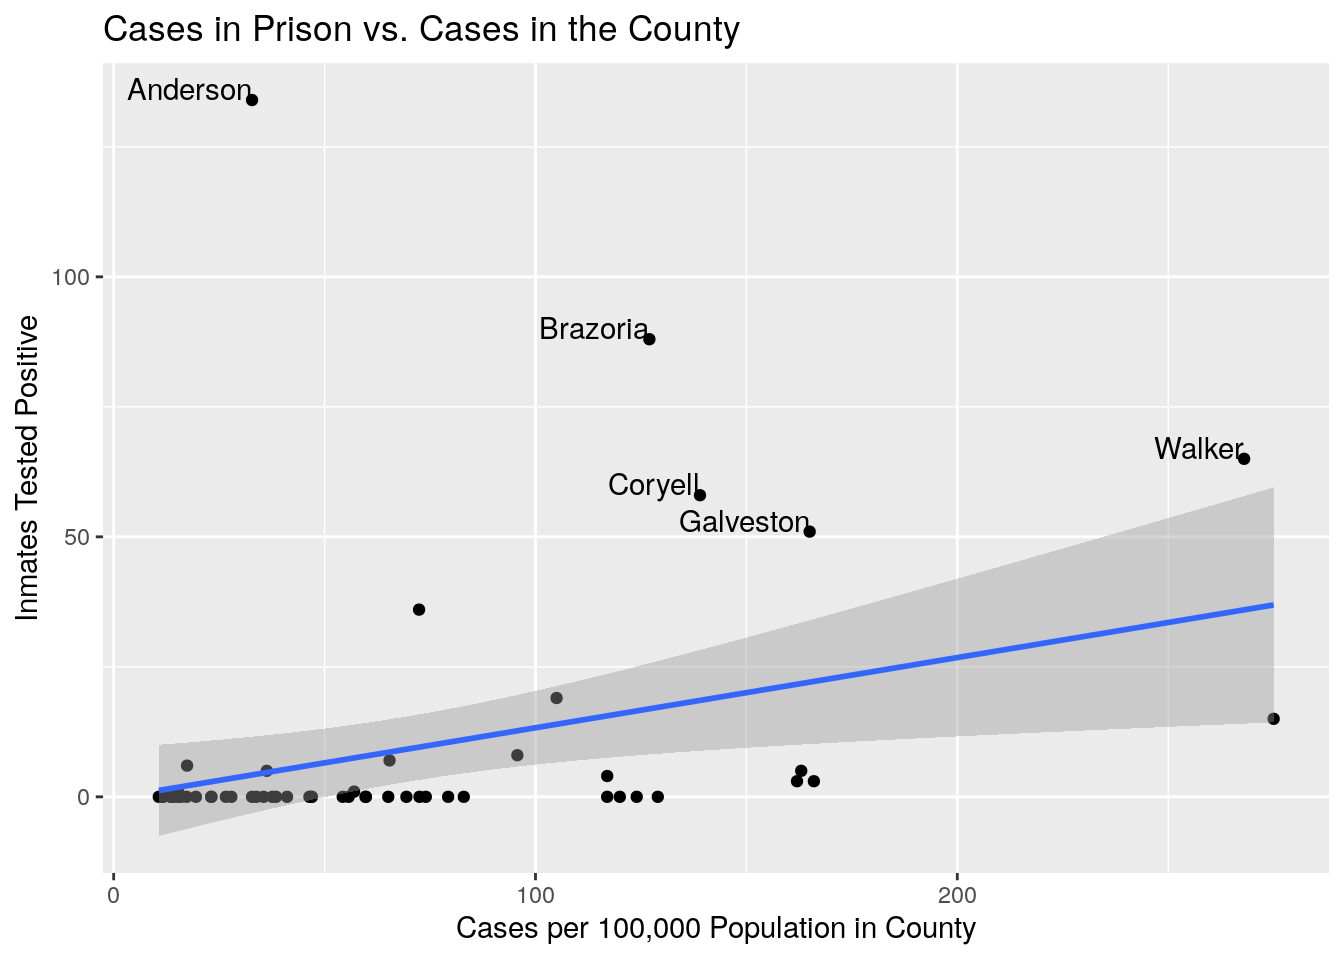
So far a weak correlation, and few of the prison units have a serious issue, thought the caveate about insufficient testing holds. Galveston is almost certainly due to inmate patients at the hospital there, which may not imply spread to the community, but I don’t know. Has a study been done on the spread of the virus from hospitals treating it via the staff?
Anderson is worrisome. While they have only 18 confirmed cases, the growth rate is high (5 day doubling time) and shows no signs of slowing. Brazoria too had looked like the curve was flattening, but in the past few days it has turned up again.
What about prison staff?
Let’s take a look at the staff, since we have the numbers.
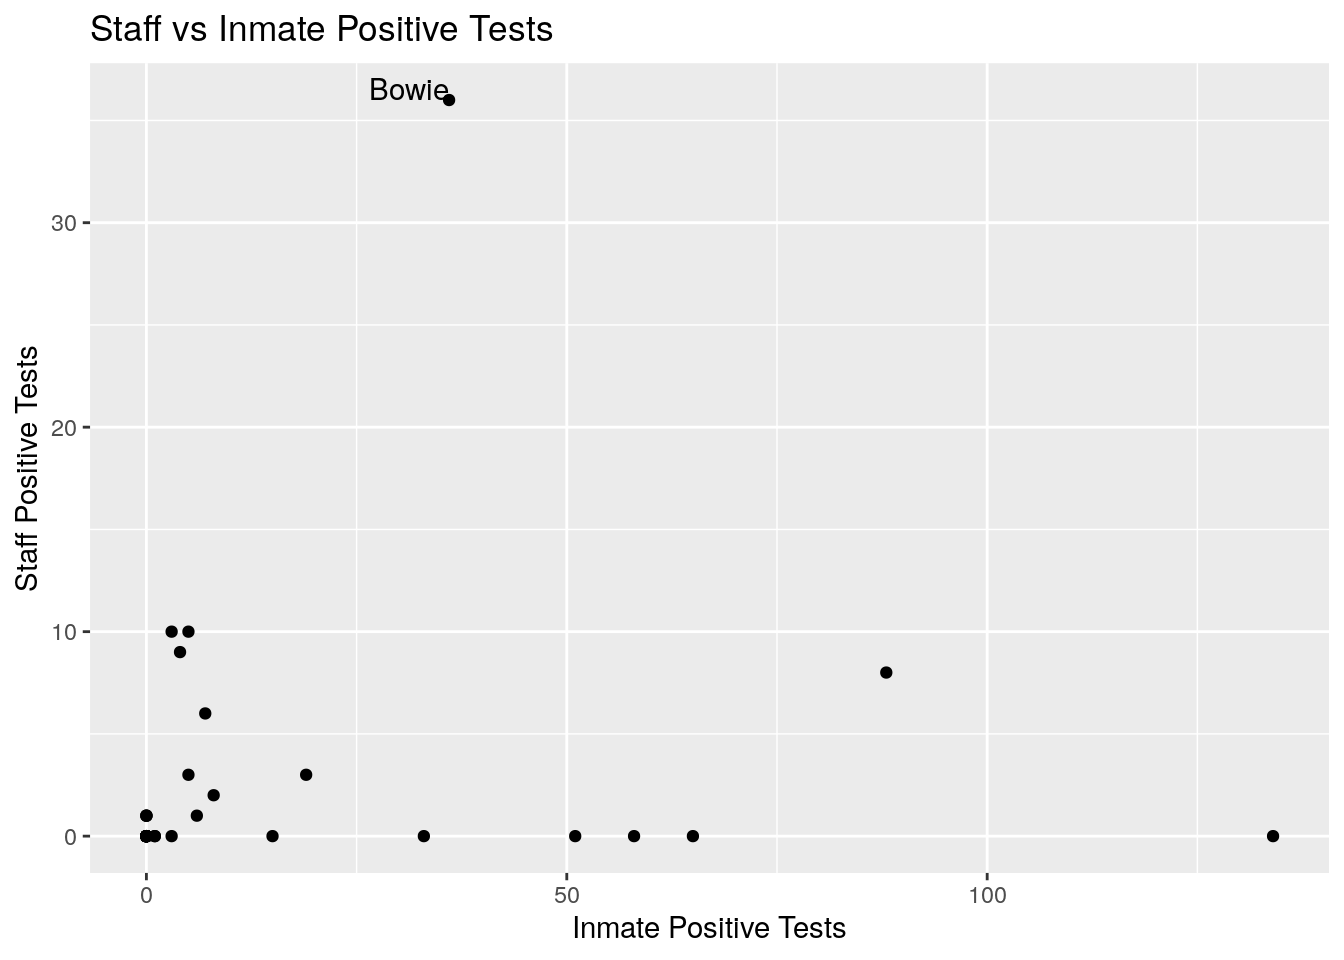
I find it worrisome that the staff and inmate numbers don’t seem to correllate. That tells me that there likely has not been enough testing, and that the inmate numbers are much higher than reported. Let’s look at the data in more detail. We’ll examine the top ten counties for staff showing positive tests.
| Top Ten Texas Counties with Infected Prison Staff | |||
|---|---|---|---|
| County | Inmate Positives |
Inmate Total Tested |
Positives |
| Bowie | 36 | 45 | 36 |
| Dawson | 3 | 9 | 10 |
| Gray | 5 | 6 | 10 |
| Dallas | 4 | 27 | 9 |
| Brazoria | 88 | 107 | 8 |
| Jones | 7 | 34 | 6 |
| Hidalgo | 5 | 7 | 3 |
| Jefferson | 19 | 33 | 3 |
| El Paso | 8 | 18 | 2 |
| Houston | 6 | 12 | 1 |
Well, that is a little disturbing. In Bowie county the inmate and staff positives are the same, but they have mostly only tested inmates who turned up positive. In the general population the infection rates I have seen are usually about 10% of the test numbers. And some of that test total is still pending. It is clear that in the prisons with the most staff infected, the testing program for inmates is woefully inadequate.
Perhaps more disturbing is that in the course of looking at Bowie county in more detail I discovered that the county officials have logged 8 deaths, yet the state shows only one. No idea what could cause that discrepancy.
It is clear that inmate testing is being restricted only to those inmates whose symptoms clearly point to COVID-19, since the majority of the tests turn up positive. It is therefore likely that the actual number of inmates who are positive for the virus is about 5-10 times larger than what has been published, and most are asymptomatic, and spreading to to others including staff, and through the staff to their local communities.
